The
SolarWinds® Papertrail™ software as a service (SaaS) Add-On in the DigitalOcean Marketplace is one of the most exciting developments to come out of the DigitalOcean and Papertrail partnership. With the Add-On, developers can seamlessly add the simple yet powerful log management Papertrail is known for to their DigitalOcean infrastructure.
In an earlier post, we reviewed how the Add-On helps teams simplify their log management tasks. Here, we’ll look at how integrating Papertrail with DigitalOcean centralizes everything you need—dashboards, alerts, visualization—for log management.
All Your Logs on One Simple Platform
DigitalOcean makes it easy for developers to quickly spin up a wide range of compute, storage, and networking infrastructure. However, as developers build apps on this infrastructure, the amount of log messages generated adds up fast.
Aggregating these logs in one place is the cornerstone of effective log management. But finding a platform capable of enabling log aggregation in a
simple, robust, and affordable way isn’t easy. Many tools are either complex to configure and maintain, prohibitively expensive, or both.
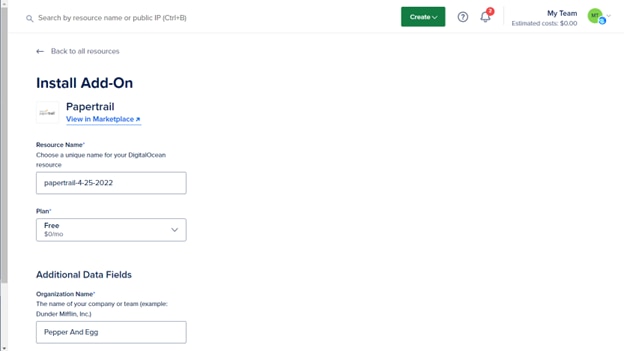
With the Papertrail SaaS Add-On, developers can configure logging in minutes. There’s no need to create a Papertrail account. Instead, you can simply select pick a plan, configure your Add-On’s details, and set up logging—all directly from your DigitalOcean portal.
From there, you can quickly begin aggregating logs from your DigitalOcean infrastructure. Because Papertrail supports most modern log sources—including Apache, NGINX, *nix systems, firewalls, and more—teams can consolidate all their logs in one place.
Customizable Log Dashboards
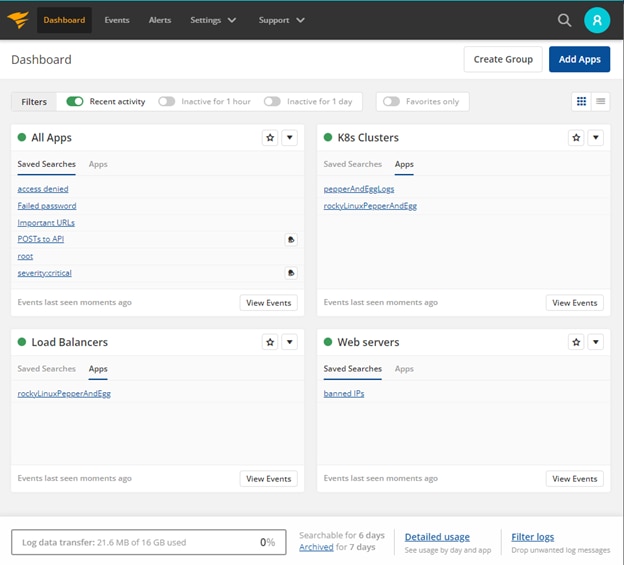
Of course, simply aggregating logs isn’t enough. Teams need to quickly and reliably capture insights from their log data. The Papertrail
dashboard allows teams to create custom search groups to display what matters to them.
The secret sauce behind the dashboards is the elegant search in Papertrail. Custom search terms allow you to create and save searches to build dashboards optimized for your infrastructure.
For example, you can configure your dashboard to include custom searches for the following:
- Error codes
- Failed logins
- Use of sudo
- Logs from a specific app or service
- Event severity
- HTTP verbs
- User agents
- IP addresses
Additionally, traffic light filters make it easy to see what groups have recent activity.
Alerts, Reports, and Visualizations
In addition to the customizable dashboard, the Papertrail SaaS Add-On gives teams tools to extract insights and detect trends in log data.
Alerts
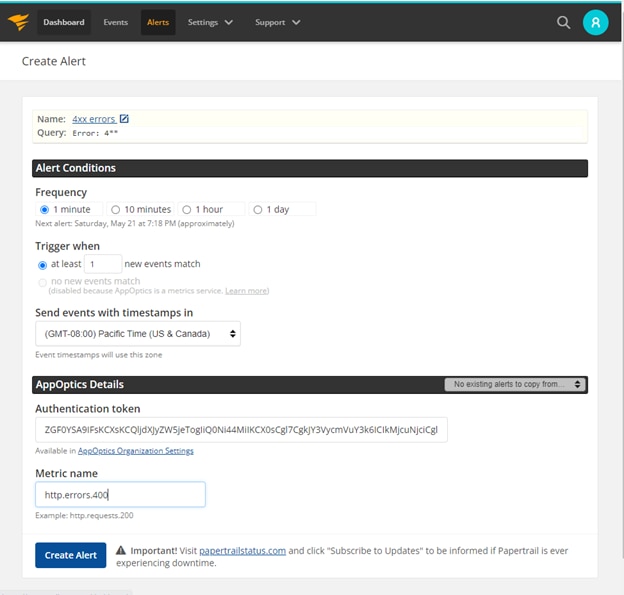
 Papertrail alerts
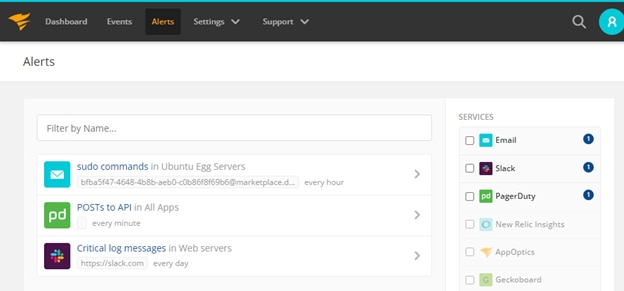
 can send notifications to external services when a log message matches specific criteria. The alerts in Papertrail make it easy to ensure the right teams are notified of infrastructure events and help you avoid alert fatigue. You can define granular matching criteria in your search and send alerts at a frequency of your choosing.
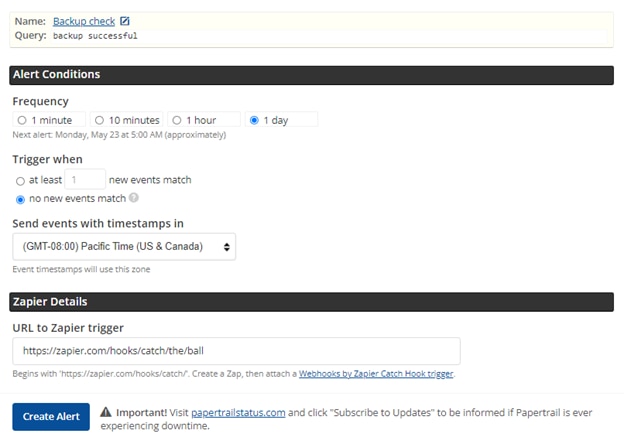
With
inactivity alerts, you can also know when something
doesn’t happen. Inactivity alerts help infrastructure teams respond quickly to issues like failed cron jobs, backups that don’t run, and other scheduled tasks that fail.
Log Velocity Graphs
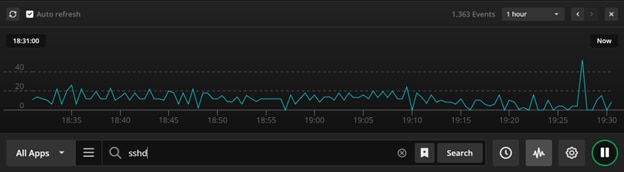
When it comes to infrastructure, visibility context is key. In a vacuum, a single log message may be trivial. But in context, a spike in log messages can be an indicator of a service-impacting incident. Papertrail log velocity graphs let you visualize total log messages or log messages matching a specific search term (like sshd, sudo, error, root, or timeout).
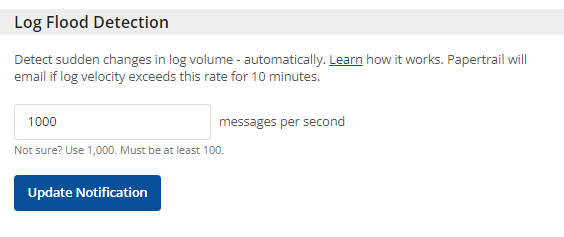
Additionally, log flood detection allows teams to receive an alert whenever log messages exceed a limit of a certain number of messages per second.
Usage Reports and Log Archiving
The account usage reports in Papertrail make it simple to identify which sources are generating the most log data and plan for increases (or decreases) in log retention and storage. You can view your usage data directly from the Papertrail SaaS Add-On and export it as a CSV file for analysis.
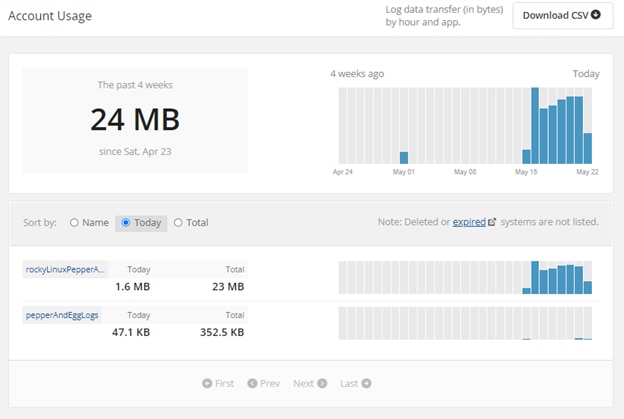
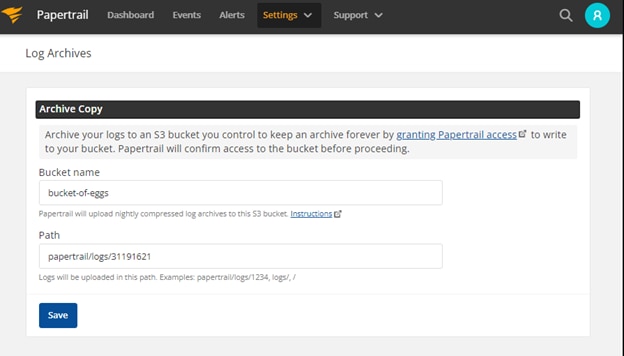
Additionally, Papertrail keeps short-term archives of log messages you can manually download and export for review. For long-term storage, you can also
send log archives to affordable S3 buckets.
You can also
send log archives to Hadoop or Hive for long-term analysis. By adding Hadoop or Hive to the mix, you’ll have interactive SQL query access to your infrastructure log archives without significant additional complexity.
Fast Granular Drill-Down
The speed of root cause analysis is often the biggest hit on your mean time to recovery (MTTR). Papertrail allows you to quickly drill down from high-level searches and apply precise search filters to real-time log data.
For example, you can run a live tail on your aggregated logs and filter for specific terms.
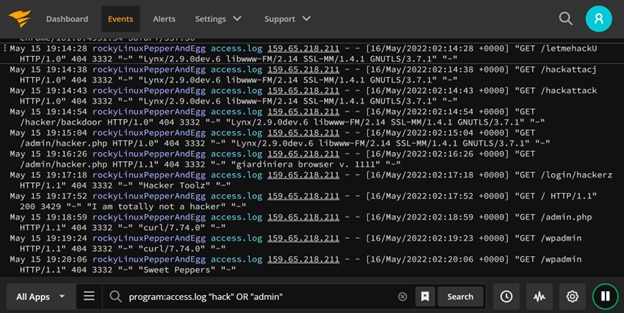
In addition to powerful search syntax, you can further filter results with the
Seek To feature, specifying a date and time range.
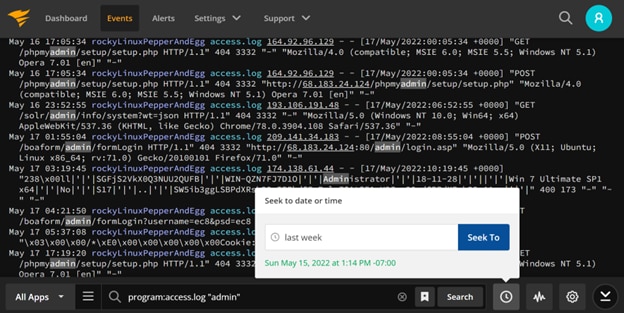
You can even jump from points in the velocity graph to specific events in just a few clicks.
Similarly, if you’re interested in a specific IP address, a single click can filter for all the available log messages with a matching IP.
The powerful yet simple approach Papertrail uses for log search lets you quickly answer the “who,” “what,” “when,” and “how many times” questions vital to incident response. This approach is especially useful in a complex microservices architecture. For example, you can use a trace ID to search across logs from multiple sources to debug an issue across multiple services.
Do More and See More—In One Place
Developers choose DigitalOcean because it enables them to build more with less complexity. The Papertrail SaaS Add-On for DigitalOcean applies this same simple philosophy to log management. With the Add-On, teams get powerful log management capable of increasing visibility across their infrastructure without the configuration complexity and tool sprawl associated with other solutions. As a result, teams can build more and see more—all in one place—with less time and effort.
Want to try the Add-On for yourself? You can get started for free by using the
Papertrail Add-On in the DigitalOcean Marketplace.