Aiming for continual improvement of the services provided to employees is an obvious goal for IT leaders, but it can be unnecessarily difficult to make adjustments without good
reporting.
The service desk is no exception. The
dozens of metrics you may track or collect information about inside your service desk solution are important to have, but they’re only as valuable as your ability to analyze and interpret this data.
Making the right adjustments to internal IT service or asset management processes needs evaluation from time to time, and can seem overwhelming. This is where easy-to-understand service desk reports and
dashboards come into play.
Tracking Improvement Over Time With Incident Trend Reporting
One of the most common and important dashboards to understand is general
incident trend reporting. This standard report can help track your overall efficiency by looking at the number of submitted tickets versus closed tickets for a given time period.
As an example, incident trend reports can help identify which agents or departments may be causing a high number of unresolved tickets over a specified time period. From there, you can dig deeper into the root cause of the backlog.
Use Case:
Service Delivery Managers –
Incident reporting can be extremely helpful for service delivery managers who need help identifying where most requests originate. Maybe there seem to be more tickets submitted by marketing over the course of a quarter. This data can help align resources to upgrade hardware, systems, or the root cause of submitted tickets.
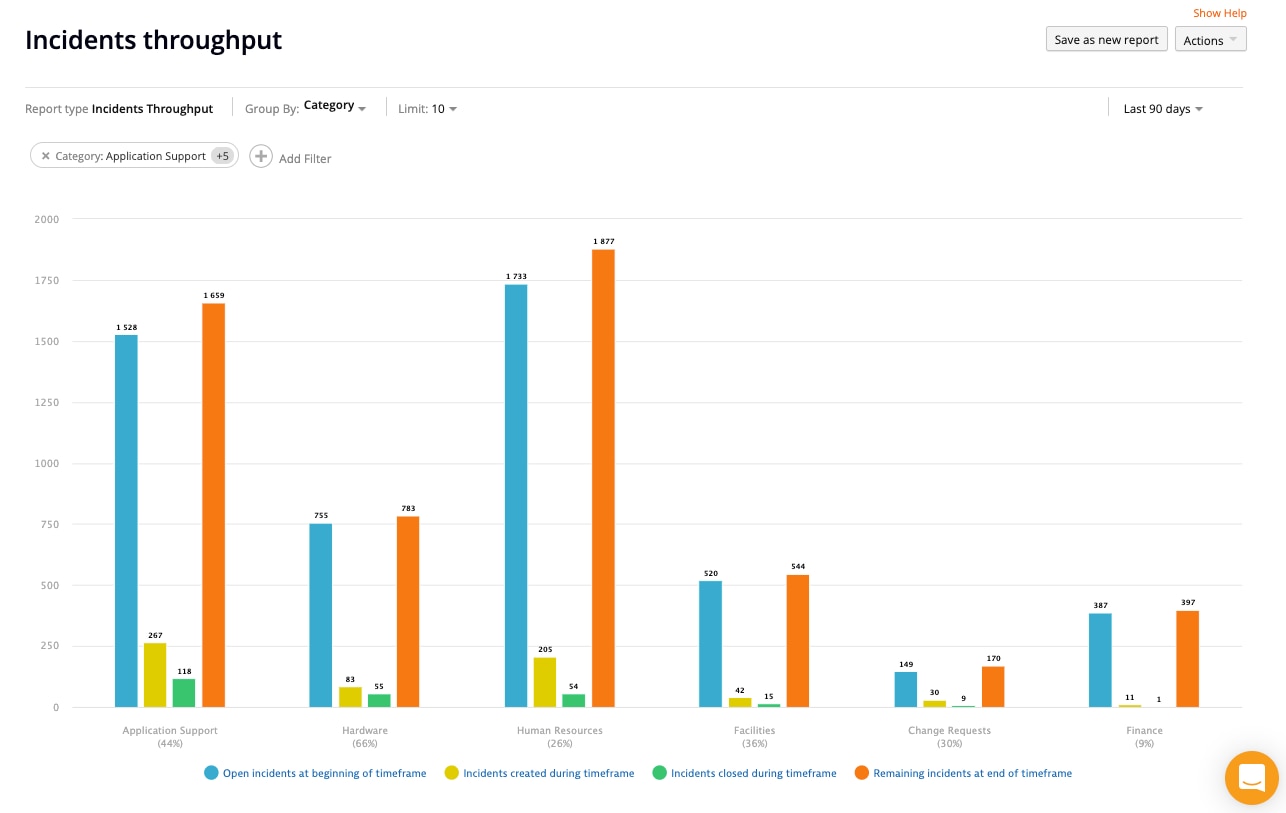
Measuring the Performance of Service Agents or Departments
As you begin to get a feel of the number of incidents coming in, running reports to measure the performance of your service desk agents can help pinpoint areas of improvement on an individual level.
By setting up service agent reporting, management can dive into potential areas of improvement for each service agent, and assess what teams are most efficient based on site or department.
If you have multiple departments responsible for delivering services, it’s also nice to have reporting to compare the performance of these departments and adjust what services each one is being asked to provide.
Use Case:
Service Desk Managers –
Incident throughput reports are helpful for assessing how many incidents are created, opened, or closed for each service desk agent to help understand their overall workload and effectiveness over a certain time period.
Optimizing Staffing Needs Using Heatmaps
As a nice addition to any incident trend report, visualizing this data by adding a heatmap to your reporting is helpful for
understanding what kind of incident volume you can expect at any given time.
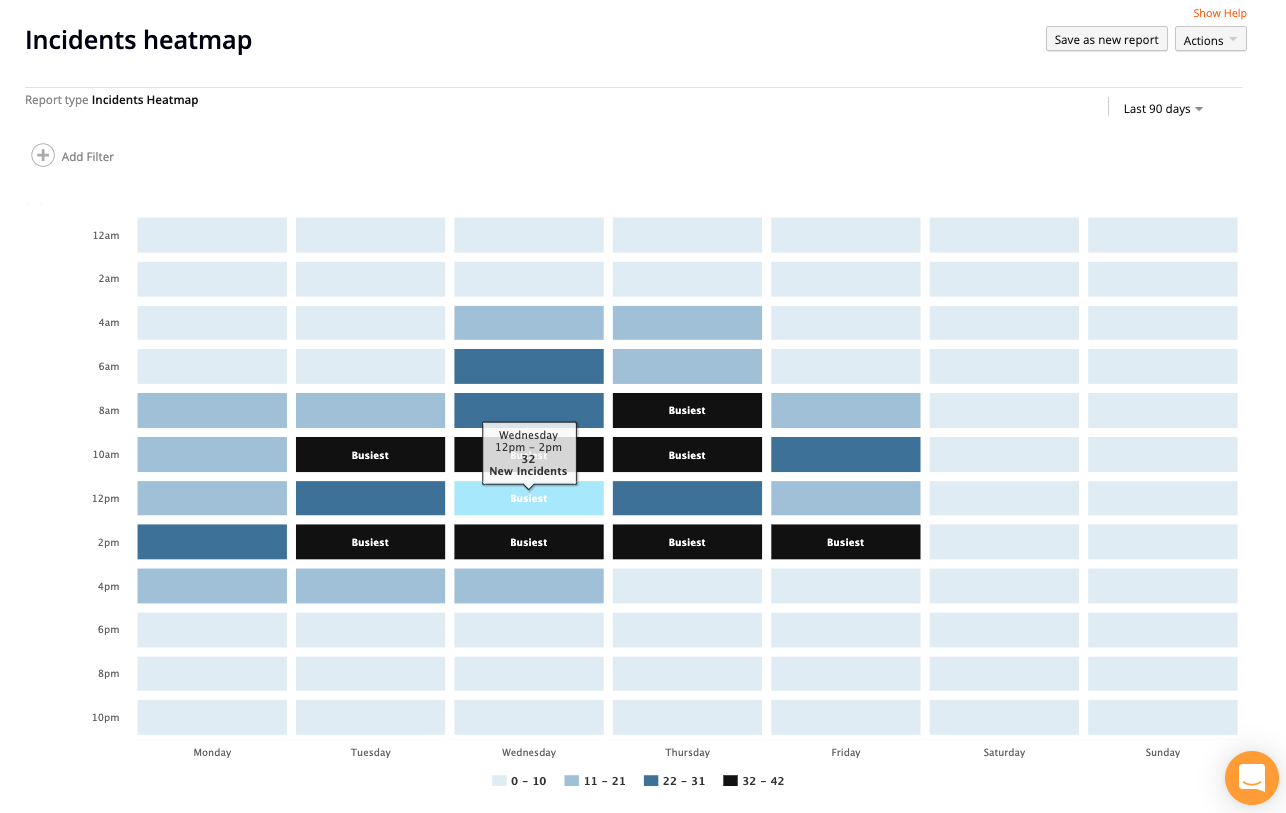
Knowing the time of day or the days of the week agents can expect an increased number of incidents allows managers to align work schedules to accommodate for peak times.
For example, if on Mondays from noon to 2 p.m., your service desk team averages 10 more incidents per hour than normal, it may be a good idea to stagger lunch breaks to accommodate this increased volume.
Boosting Customer Satisfaction (CSAT) Scores

Encouraging improvement on a one-off basis whenever an individual customer satisfaction issues occurs helps, but a
customer satisfaction report identifies trending areas of improvement over time on a more granular level.
Simple customer satisfaction surveys are a great way to collect feedback, and CSAT reports can help to visualize employee (aka your customer) satisfaction over time.
Sometimes it’s helpful to know which service agents, requesters, or even departments are linked to positive or negative feedback, so managers can provide additional resources or training as needed.
Use Case:
Business Relationship Managers –
Customer satisfaction reporting can be helpful for business relationship managers by visualizing and tracking the percentage of unsatisfied requesters in relation to all other CSAT responses over a given time period.
Improving Visibility of Software and Hardware Assets
Aside from reporting on information like incidents or CSAT scores, asset reporting is great way to determine what hardware or software assets are currently in use or available to use in your organization.
When it comes to forecasting purchasing or procurement needs, having reports to collect this data helps you see what you have available, avoid unnecessary purchases, and stay under budget.
Dashboards are great in the context of viewing anything from computers by status, operating system, and even location. Custom filtering is also helpful when you need to run a report to locate computers that may have an old operating system installed, or anything else you may need to know.
Use Case:
Asset Managers – A
computers summary report is helpful for asset managers looking to make hardware purchasing decisions based on what operating system versions are most common and what computers may need to be replaced.
Monitoring SLA Breaches
A Service Level Agreement (SLA) is simply an agreement between a service provider and a requester based on agreed-upon benchmarks or standards for service.
Knowing when a service provider has breached the service level agreement is important to monitor within the service desk to ensure your organization operates at peak performance.
An SLA breach can be as simple as failing to respond to an incident within an agreed-upon timeframe or failing to assign a high-priority problem to a technician within 24 hours.
Adding an SLA management widget to your service desk dashboard is an easy way for service delivery managers to see how many incidents have been breached each day.
Custom SLA reports are also helpful for managers who may need to dive into specific details, like the most common types of SLA breaches or which assignee or departments may need additional support or training.
Usability by Key Stakeholders
Introducing service desk reporting and making it available to various departments and key stakeholders throughout your organization is a great way to give managers access to the data they need to make decisions.
With all the important data points collected inside a modern service desk, taking a moment to configure reporting is a practical next step to implement if you haven’t already.
These reports can be scheduled to automatically deliver to any leader who may only want to dive into this data on a weekly, monthly, or quarterly basis.